What are pivots?
If you have ever wondered why the price of the currency pair or index you are following just stops short of anything that you have on your chart, there is a chance that it has run into a pivot level.
Pivots were developed by floor traders to determine key buying and selling levels. These floor traders were the original day traders. The calculations were relatively simple which was just as well as they did not have charts and calculators! Today it is normally a case of adding them to a chart at a press of a button with no manual calculations necessary.
Since the early days there are numerous tweaks to the calculations for different trading schools, i.e. you will find the likes of Woodies Pivots and Fibonacci. Personally we prefer the standard floor pivots. The reason for this is that the more traders that use a particular type, the more likely the levels will see a reaction, a self fulfilling prophecy. We may well add the different calculations on this site in the future but at present we will stick with the tried and tested floor pivots.
So what precisely are they?
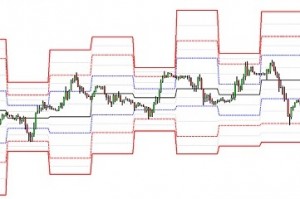
They are a series of support and resistance levels calculated from the previous period as shown in the screenshot above. In this example I have shown 3 levels of support and resistance. Some older charting indicators only show 2 levels, although it is not unusual to see a fourth level added on some.
The main pivot point/ level is derived from the sum of the high, low and close divided by three. From this point the levels of support and resistance can be calculated using the following calculations;-
- Pivot point PP = Previous period (high+low+close)/3
- R1 (resistance level 1) = (PPx2)-low
- R2 (resistance level 2) = PP+(high-low)
- R3 (resistance level 3) = R1+(high-low)
- S1 (Support level 1) = (PPx2)-high
- S2 (Support level 2) = (PP-(high-low)
- S3 (Support level 3) = S1 -(high-low)
As already mentioned some traders add a 4th level of support and resistance but we have not included that level at present as the majority of the time the price is contained by the S3 and R3 pivots.
They can applied to many different time frames, the most common is the daily. They are very powerful on the monthly time frames and to a much lesser extent the weekly time frame (with the exception of the main weekly pivot point). Day traders will use also use them on the four hourly basis and some even go down as low as the hourly basis although the latter has questionable value in our opinion.
We tend to add the mid-way levels between the main pivot levels. The effectiveness of these is questionable although we have noticed on wider ranging days they can provide support and resistance levels. They can also be consider for placing stops if trading using pivots.
How are they used?
There are many different strategies that apply pivots, we have selected and designed our own strategies which are included in membership of this site. A key benefit of using pivots is that they are static in the period you are using them thus it is relatively straight forward to analyse the probability of certain strategies.
Our analysis has proven to us that many of the common Pivot strategies widely available are in fact flawed and have very modest probability of being successful unless certain rules are applied. There are some key factors that can be shared here which we do agree with in general.
The basic premise is that whilst price is above the main pivot point, the market is erring to the bullish side and visa versa. This is generally the case so long as the higher time frames are reflecting the trend. Thus if we have a clear trend of higher lows and higher highs then if the price breaks up above the pivot point it would be deemed as becoming bullish. At this point some traders might buy with the target of the R1 level.
The same principle could be applied to a bearish market which is making lower highs and lower lows. Thus a break of the pivot in line with this trend might give a bearish target to the S1 level. This is a very simplistic way of using pivots but can provide reasonable returns if the risk reward is in the traders favour. An example of this is shown below.
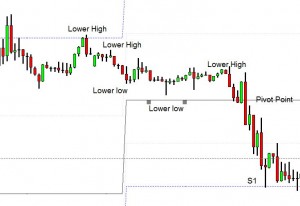
The above is not a strategy, you need to add rules regarding stops and ensure the risk to reward works. Then of course you would need to test it over a reasonable time to ensure that it works.
The support and resistance levels can be targets as well and levels where profits may be taken. If you knew that there was only a 7% chance of a level being broken, would this make a reasonable exit point? If you also knew that it only had a 3% chance of closing above that level give you even more reason to consider at least taking part profit?
Unless driven by news taking trades with targets outside the daily R2 and S2 levels can be risky as many traders see these areas as the ceiling and floor or the market.
There is much more to consider with these levels, particularly if combined with other studies such as moving averages. Confluence with any other indicator always increases the probability as more traders are likely to see the opportunity and thus it becomes a self fulfilling prophecy. We challenge you to add pivots to your current chart and review some of your recent trades, you might be surprised. Remember that they can act as either entry levels or exits.
What can you trade with them?
We tend to trade mainly currencies although they clearly work on stock indices and commodities. Any continuous market should give good results, that said we have looked at some of the higher volume stocks and noticed that even on the cash markets they can provide strong points of support and resistance.
Some of their other benefits
Of all the strategies that we have used over the years the great thing about pivots is that are adaptive. The simple process of their calculation means that they reflect the current trading ranges. Providing you are using just one type they are not subjective either, a pivot is either hit or not.
They are rigid for the period unlike moving averages which may suggest price has hit the level, but what often happens in reality is that the moving average moves down to the price.
Unlike most indicators this is a predictive indicator. We know what the levels are in advance giving us the opportunity of setting orders up and walk away.
Using the statistics we can not only look for entry points but can also identify exit points. An example may be when price is rising to the third level of resistance on the euro/dollar pair on where there is only a small chance of price closing above this level for the day <5% in 2015). For intra-day traders this can be invaluable information.
Finally as already suggested, Pivots provide us with a framework to trade with combined with other indicators and traditional simple analysis. They are a great indicator for any day or swing trader to add to their tool box if if not used as a primary indicator for strategies.