Open orders
The following links provide a overlay of open orders onto a chart with the 4 hourly pivots. Please note that the pivot levels may vary slightly from other levels on charting packages, but they are generally very close.
How do we use them?
The charts show the net position of the open orders. Thus if we see a lot of buy orders below the price this may act as a level of support whereas a sell orders may become a target level for shorts. The reverse may occur on the upside where the buy orders are often traders stops and thus become targeted and the sell orders become resistance.
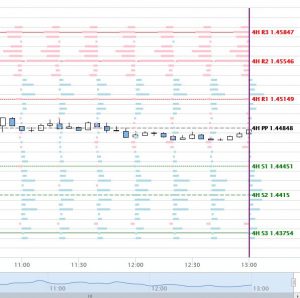 The example shown on the left shows net buy orders above the current price level just above the 4 hourly R1 pivot. Of course there are no guarantees that price will run for these levels, but if it does start heading up it allows us to hold the position into the point of resistance which in this case may come in at the 4 hour R2 where there are significant net sale orders.
It should be noted that these are a guide. When key news events occur or in strongly trending markets, the support and resistance levels provided by order flow can be brushed aside. Another thing to watch for is that traders can be fickle and orders can be removed or opened at any time, thus it is worth updating the page at regular intervals. The volume levels will generally update every 20 minutes.
GBP/USD order book
EUR/USD order book
AUD/USD order book
USD/JPY order book
USD/CAD order book
NZD/USD order book